Stay Home. Stay Safe. Break the Chain.
The precise rules of lockdown vary from country to country, but in New Zealand we’re really not supposed to go anywhere at all unless it’s completely necessary. Don’t go to the beach, don’t go stay in your holiday home for the duration like some kind of medieval aristocrat, don’t even get takeaways for dinner. Not everyone is getting the message, but for the most part it seems to be working.
But suppose, apropos of nothing, that you really did have to travel long distance for something essential. Flying is out, unless you’re a topdresser, which for practical purposes just leaves driving (I’m not actually sure what your options are right now if you really have to cross between islands).
Jokes aside there are still a few legitimate reasons why you might have to travel long distance right at the moment, possibly even on a regular basis: some people do have medical conditions that cannot be treated locally, and of course somebody has to drive the trucks to transport food and medicine (it would be nice if we had better rail freight infrastructure in this country, but there’s nothing that can be done about that now). Still, and again not naming any names, there are some people whose journeys seem slightly less essential.
Forbidding long distance travel has numerous rationales: by travelling you risk exposure to more people, while also potentially acting to transport the virus from place to place. But if that’s not enough to convince you, consider this: now would be a really bad time to get in a car crash.
“But Petra,” you say, “all those terrible drivers are off the road. It’s just me, an above average driver at worst, so how could I crash?”
While it’s true that there being drastically fewer drivers on the road is almost certainly going to lead to far fewer crashes overall, that doesn’t neccesarily mean you personally are that much safer. It may take two to tango, but not all crashes are head on collisions and you’re perfectly capable of coming to harm all by yourself.
The question then is what proportion of open road crashes—and particularly, fatal ones—only involve the one car? I couldn’t find this statistic directly, but the NZTA does publish disaggregated crash data. This dataset claims to have last been updated in December of 2019 to include data up to the end of June 2019, although as far as I can tell it actually runs from January 2000 to only September 2018. The dataset can be downloaded manually, or from within R like so:
download.file("https://nzta.govt.nz/assets/Safety/docs/disaggregated-crash-data.zip",
              "disaggregated-crash-data.zip")
unzip("disaggregated-crash-data.zip", "finaldata_201809.csv")
dat <- read.csv("finaldata_201809.csv")
save(dat, file = "crashdata.Rdata")

# ----

# load 'dat' back into environment in future sessions
load("crashdata.Rdata")
A word to the wise: the zip file is 31.5MB, and the csv inside of it is a whopping 259.8MB, while the serialised R dataframe is saved in an Rdata file at only 19MB. I really suggest learning to do this with datasets of a non-trivial size.
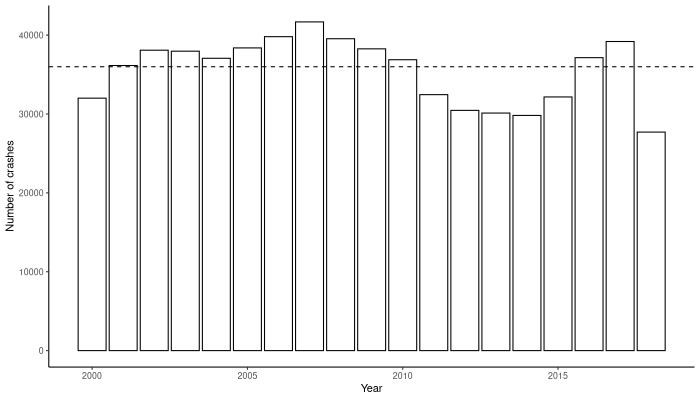
The dataset contains entries of 674,811 crashes over the 18¾ years, or an average of about 36,000 per year (dashed line, above). The dip in 2018 appears to be from the missing data, not because that year was any less dangerous.
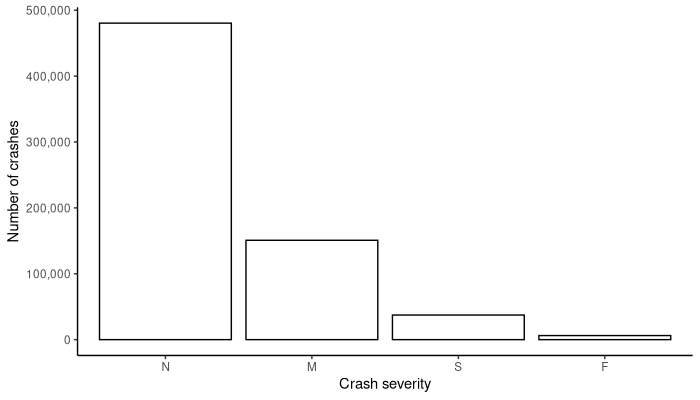
Of course, not all crashes are fatal, and for that matter not all kinds of crashes.
| Vehicles\Severity | N | M | S | F |
|---|---|---|---|---|
| Cyclist(s)+Pedestrian(s) only | 7 | 85 | 69 | 0 |
| Cyclists only | 12 | 769 | 342 | 12 |
| Multi vehicle | 345619 | 73006 | 14416 | 2722 |
| Other | 0 | 68 | 37 | 10 |
| Others without non-parked veh | 0 | 7 | 2 | 0 |
| Single vehicle | 128521 | 53222 | 15003 | 2534 |
| Vehicle(s)+Cyclist(s) only | 3997 | 10826 | 2645 | 173 |
| Vehicle(s)+multiple other types | 289 | 595 | 189 | 32 |
| Vehicle(s)+Pedestrian(s) | 2007 | 12256 | 4644 | 695 |
As you can see, a surprisingly large proportion of crashes, including fatal ones, are single vehicle affairs. However I’m not interested in all crashes, but instead the subset that occured on the open road, and specifically on state highways—which our hypothetical lockdown-dodger is presumably using to get across the country, assuming they don’t know where the checkpoints are located.
| Vehicles\Severity (Rural SH) | N | M | S | F |
|---|---|---|---|---|
| Cyclist(s)+Pedestrian(s) only | 0 | 0 | 0 | 0 |
| Cyclists only | 0 | 29 | 24 | 1 |
| Multi vehicle | 49107 | 16171 | 4671 | 1647 |
| Other | 0 | 6 | 2 | 0 |
| Others without non-parked veh | 0 | 0 | 0 | 0 |
| Single vehicle | 42866 | 17821 | 5009 | 913 |
| Vehicle(s)+Cyclist(s) only | 53 | 279 | 150 | 41 |
| Vehicle(s)+multiple other types | 0 | 1 | 2 | 1 |
| Vehicle(s)+Pedestrian(s) | 39 | 187 | 228 | 158 |
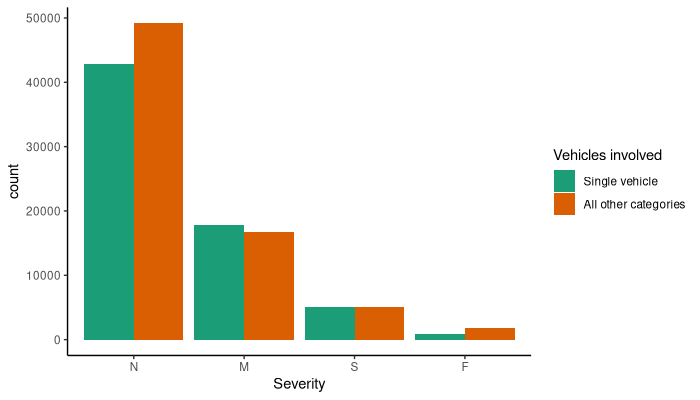
This gives 139,406 crashes over the period, 2761 of which resulted in fatalities. The important part of the table then is the Single Vehicle line as a proportion of the others: approximating the proportion of open road state highway crashes that might have still occured had there only been the one car on the road at a time. This comes out to 48% of all crashes, though only 33% of the fatal ones.
This is a fairly large percentage: you should not assume that you’re safe when there are no other cars.
In fact you’re probably a lot less safe than usual. Under normal circumstances when taking long car trips you should make regular stops to prevent sleepyness, whether for petrol-station coffee or a diversion to a scenic lookout. But there’s nowhere to buy coffee from anymore, and lookouts are severely discouraged, neither of which is condusive to safe driving.
If you can avoid driving, don’t drive. And if you can’t avoid it… make sure you really can’t—and stay safe.
The source files for this analysis can be found on my gitea.